Open Performance > Baseline in the left rail to reach the Baseline Overview.

If a baseline is already set for the active workspace, you will be directed to your baseline footprint report, which consists of a dashboard and a full report. The creation flow will also redirect you here once the calculation is finalised. By default, the PEF tab is selected. To view the baseline report using the GHG Protocol methodology, click the GHG tab under the report's title. The tabs are PEF, GHG, Risk and Data quality, each where your plan includes it. This article focuses on the PEF tab.
The report header
Every baseline, historical report and volume forecast opens with the same header: the report's name with its period, products and units, then Products CSV, Download PDF, Reset baseline (on the current baseline) and See full report. The views are tabs beneath it: PEF, GHG, Risk and Data quality, each where your plan includes it. On the Risk and Data quality tabs, the header keeps Download PDF and See full report, which opens the PEF full report.
Reset baseline, in the header, clears the baseline for the whole workspace after asking why, and keeps a read-only copy under Past baselines. Once a baseline has been replaced, a selector in the header switches between the current baseline and past ones. See How do I reset, restate or read a past baseline?
Products CSV, in the header and beside the full report's Volumes table, lists the products the calculation included: product, SKU, product ID, which product a model is of, product type, units, net amount per unit, unit, category and category group. Products it left out, such as drafts and products not in production, are not listed.
The PEF tab
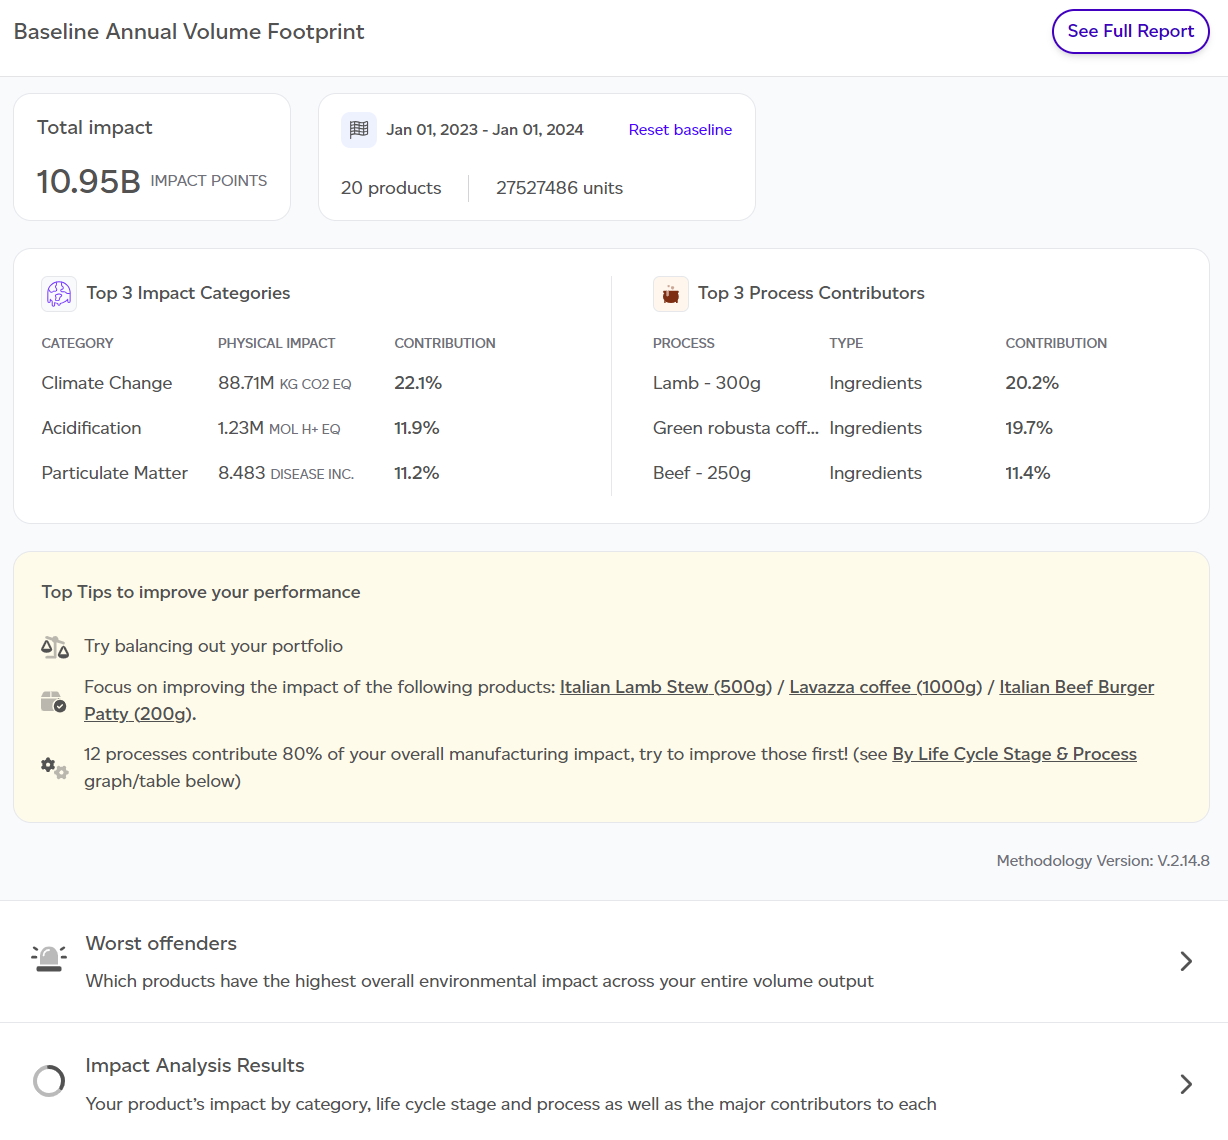
The PEF tab reads, from the top:
- A summary band: one sentence on the baseline's total, for example "The baseline is 12.85B impact points. Climate Change is 27.7% of it, raw materials carry 90.2%, and the top 3 products carry 33.6%." Beside it is the climate change figure in CO2e and, with GHG on your plan, a link explaining why the GHG Protocol total differs.
- A first-party data line: First-party data 100%, or Screening LCA threshold not met when products in the report have less than 100% first-party data. Read more explains it.
- Four key figures: Total impact, Top category, Top life cycle stage and Top process.
- On Risk & Analytics plans, Where the impact comes from and Where the impact concentrates (see below).
- Impact values & contribution by category, Product performance (for the overall impact, its CSV lists every product in the report, not only the top 10), Highest and lowest impact products, By product category and Impact distribution by life cycle stage.
- Tabs at the foot: Tips to reduce the impact, Circularity where the products use co-products or residues, and Equivalences translating the physical outputs into familiar comparisons (car journeys, showers, basketball courts). A PDF prints every tab.
By product category groups the products by their category, each group opening onto its categories, with each one's share of the impact and of the volume. See Product categories.
Co-products and circularity
Each co-product is counted once. Each product shows its own share; a co-product's share, by mass at the step it leaves, is on its own line, less what the report's products use as an ingredient, since they carry that part. A by-product takes no share. The report lists its co-products and by-products with what is counted on each. See Co-products and by-products.
Where the report's products use co-products or residues, a Circularity tab at the foot of the PEF tab (and a section after the breakdown in the full report's LCIA tab) gives the share of input mass from them and the impact they avoid compared with the conventional ingredients they replace, across the portfolio, with the top products using them. It sits beside the totals and is never subtracted from them. See Circular ingredients: co-products and residues.
Where the impact concentrates
Above it, Where the impact comes from puts the report's raw material origins on a map; pick one to see the raw materials and suppliers behind it. On Risk & Analytics plans, Where the impact concentrates traces the report's impact to its Raw materials, Countries, Suppliers, Processes and Products, at the report's volumes, for any impact category. Each list shows its share, the impact per kg and the share of primary data, and downloads as CSV. It sits on the overview and in the full report's Concentration tab.
Downloading a PDF
Download PDF, in the report header, saves the tab you are on as a PDF: PEF, GHG, Risk or Data quality. A cover page names the report, the view and the workspace, and on the overviews the period. All sections are opened out in the PDF. If your company has a logo, choose With [company]'s logo or Sustained only when you download. See How do I download a volume report as a PDF?
Screening LCA threshold not met

If any product in the baseline has less than 100% first-party data, a line under the summary says Screening LCA threshold not met: defaults were applied, so read the figures with caution.
Full Baseline Report
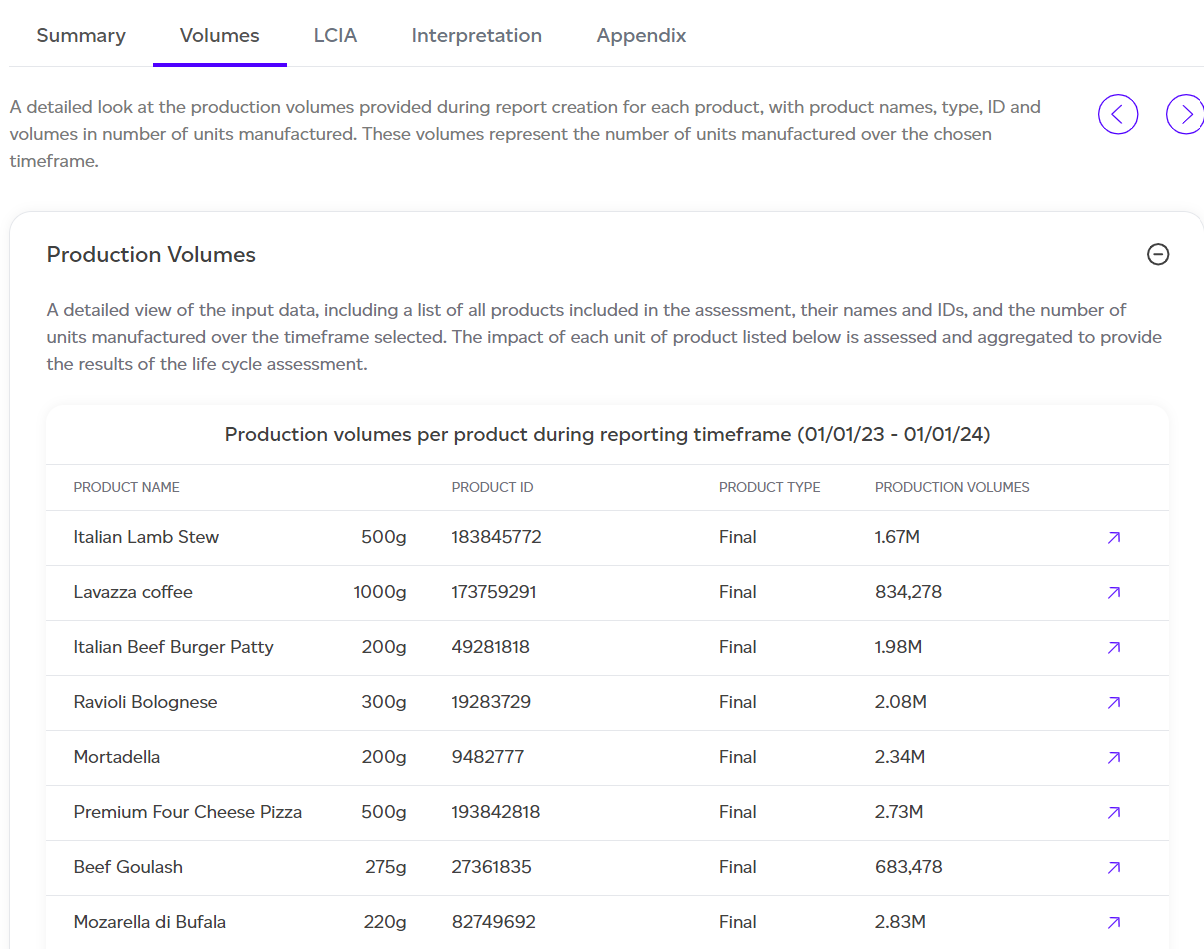
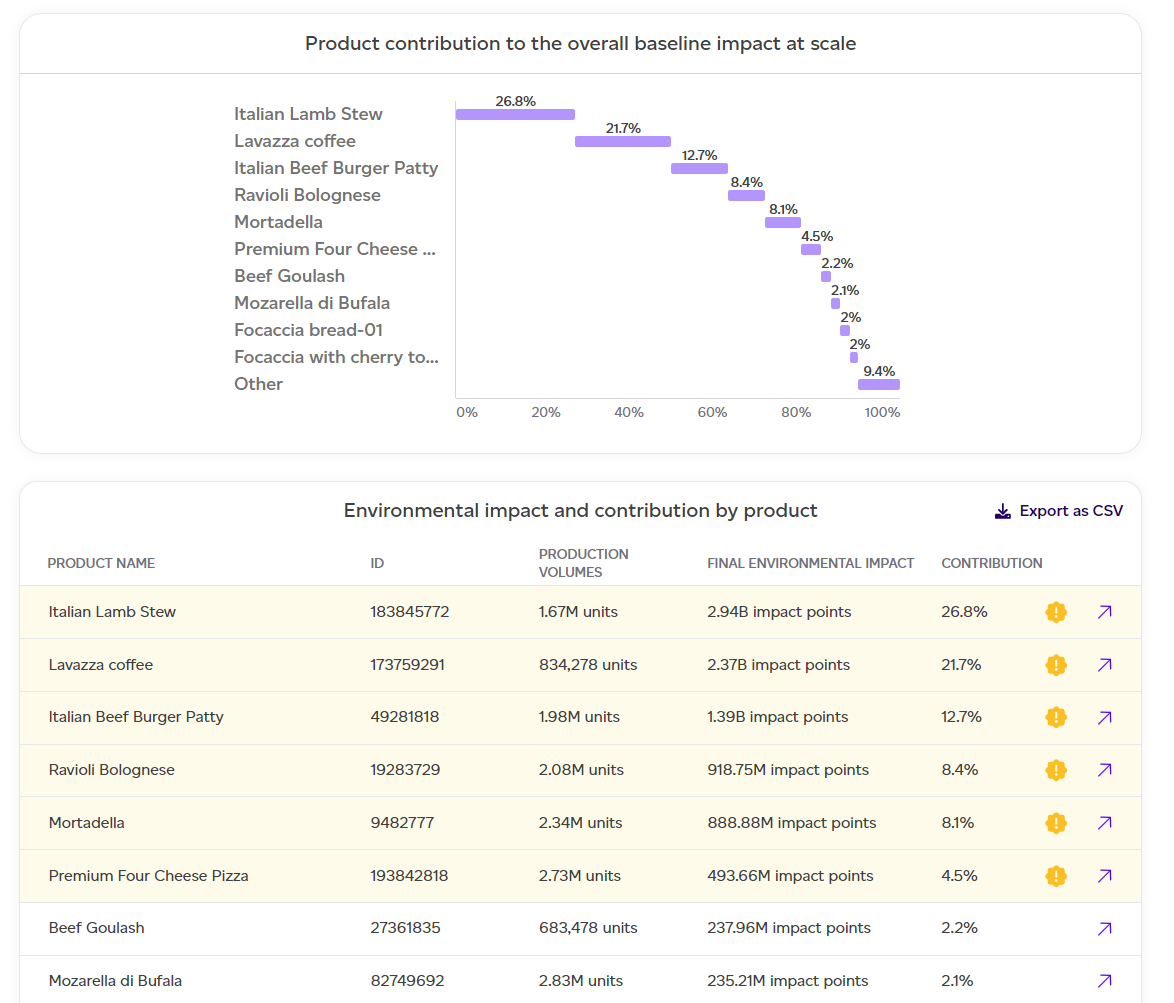
From here, you can also view the full baseline report, which follows a similar structure to other reports but with slight differences in the section contents. To access the full report, click See full report in the header.
The full report includes:
- Summary: Presents an overview of the assessment, including the number of products, units, and total impact.
- Volumes: Summarises the production volumes used in the baseline calculation.
- LCIA (Life Cycle Impact Assessment): This section includes a new 'impact by product' lens, showing results in the following ways:
- Impact by product
- Impact by category
- Impact by life cycle stage
- Impact by process
- Interpretation: Provides additional context and contextual examples to help translate the impact results, including comparisons to familiar benchmarks like car journeys or household activities.
- Appendix: Includes four appendices:
- Detailed breakdown by product
- Detailed breakdown by impact category
- Normalisation and weighting factors
- Assumptions behind the contextual examples
Data in tables can be exported as CSV by clicking on 'Export as CSV'.