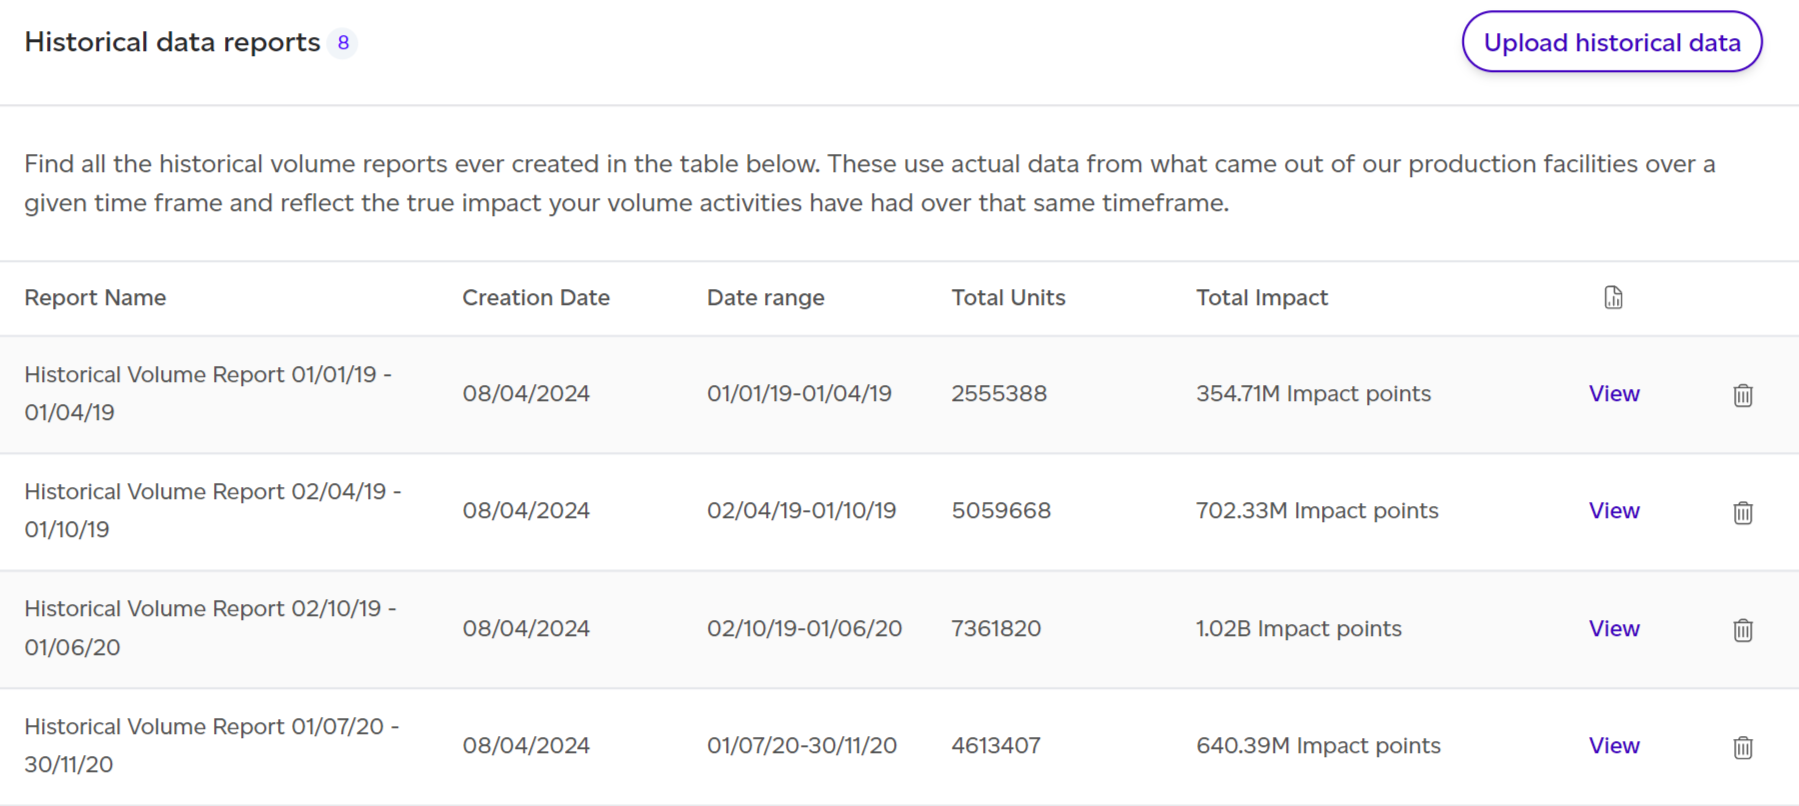
Access historical reports by selecting Volume from the top menu, then choose Historical Reports. From the resulting list, click 'View' next to your desired report.
Dashboard Overview
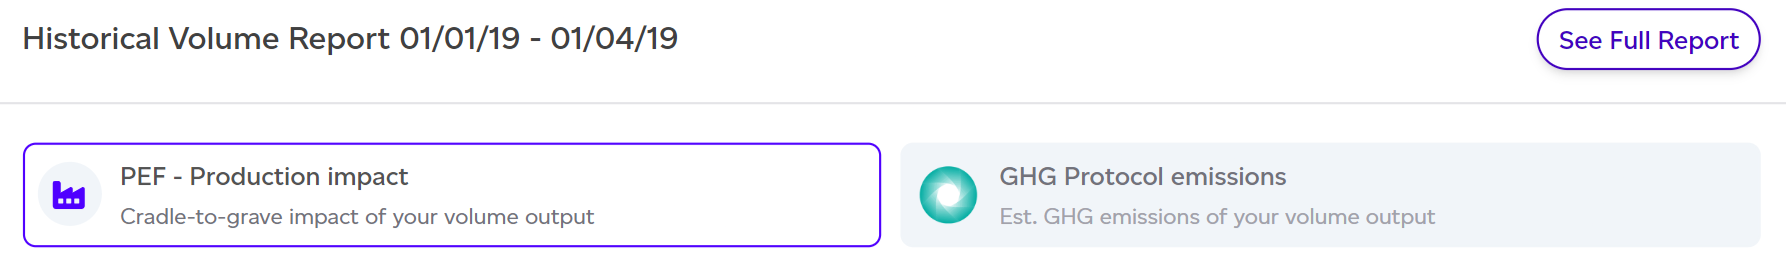
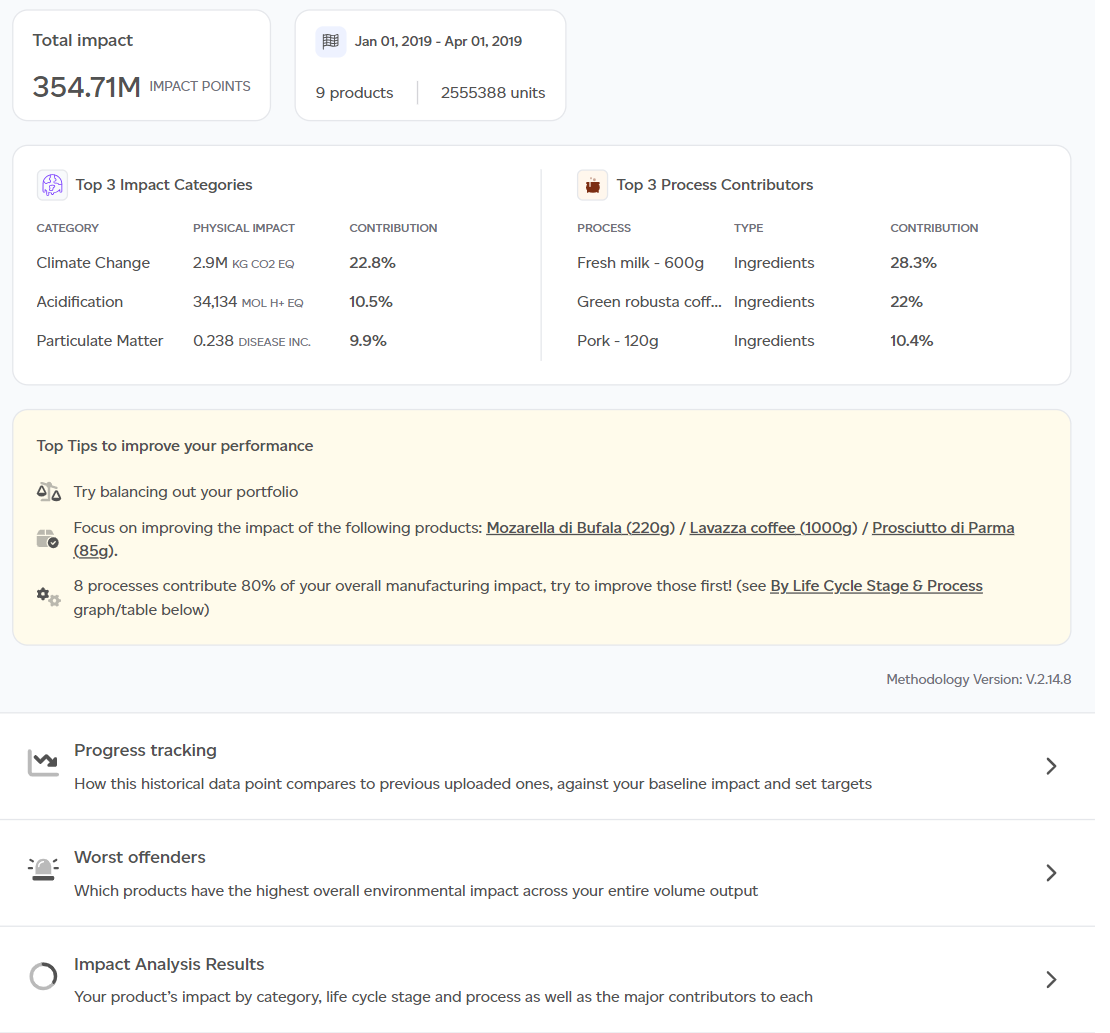
The default PEF Production lens displays key insights:
- Total environmental impact from manufacturing output.
- Actual manufacturing throughput overview (product SKUs, total units, date range).
- Top 3 impact categories and processes.
- Top 3 improvement recommendations.
- Contextual examples translating outputs into relatable comparisons.
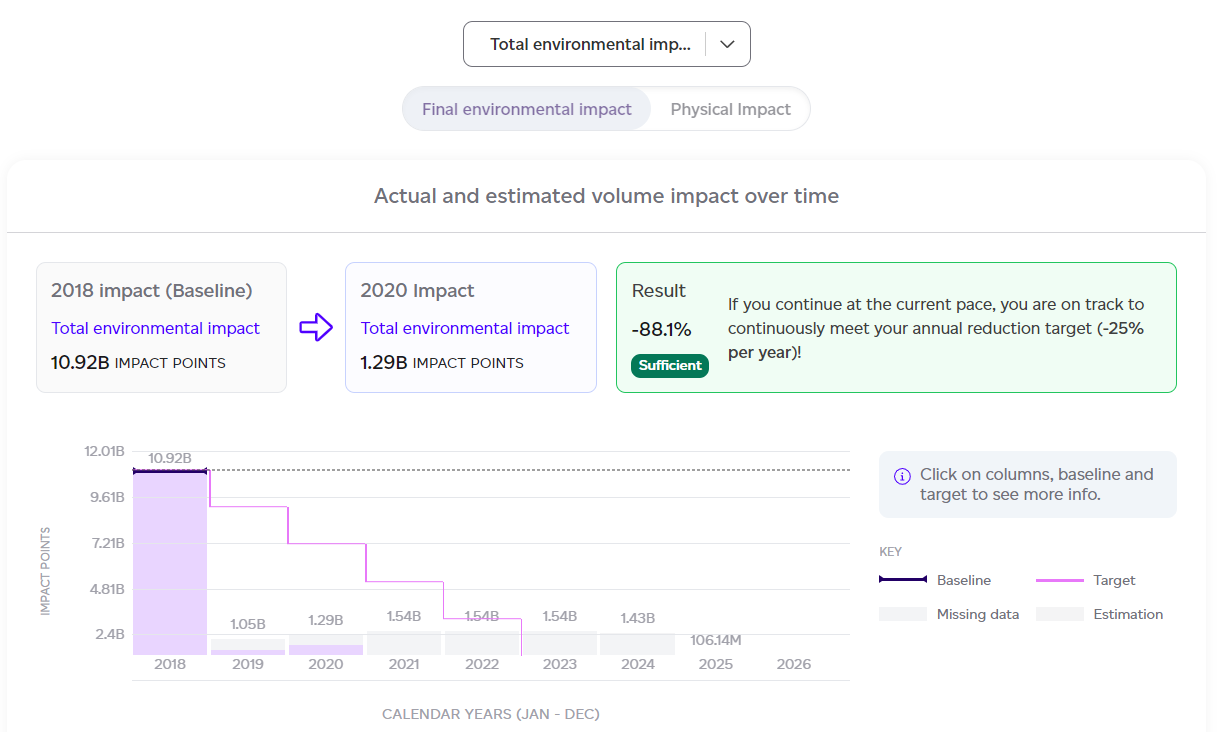
- Progress tracking graph showing baseline, historical data, and targets.
- Worst-performing products.
- Product SKU contribution breakdown.
- Highest and lowest impact products.
- Impact breakdown by category, life cycle stage, and process.
- Major contributors summary.
You can switch to the GHG Protocol emissions tab to view results using alternative methodology.
Full Report Structure
Click 'See Full Report' to access comprehensive details organised into tabs:
- Summary — Product count, units, and total impact overview.
- Volumes — Production volumes used in calculations.
- Progress tracking — Baseline comparison, previous data points, targets, and likelihood of meeting goals.
- LCIA (Life Cycle Impact Assessment) — Results split by product, category, life cycle stage, and process; exportable as CSV.
- Interpretation — Contextual examples clarifying results.
- Appendix — Includes detailed product breakdowns, impact category analysis, normalisation factors, and contextual example assumptions.