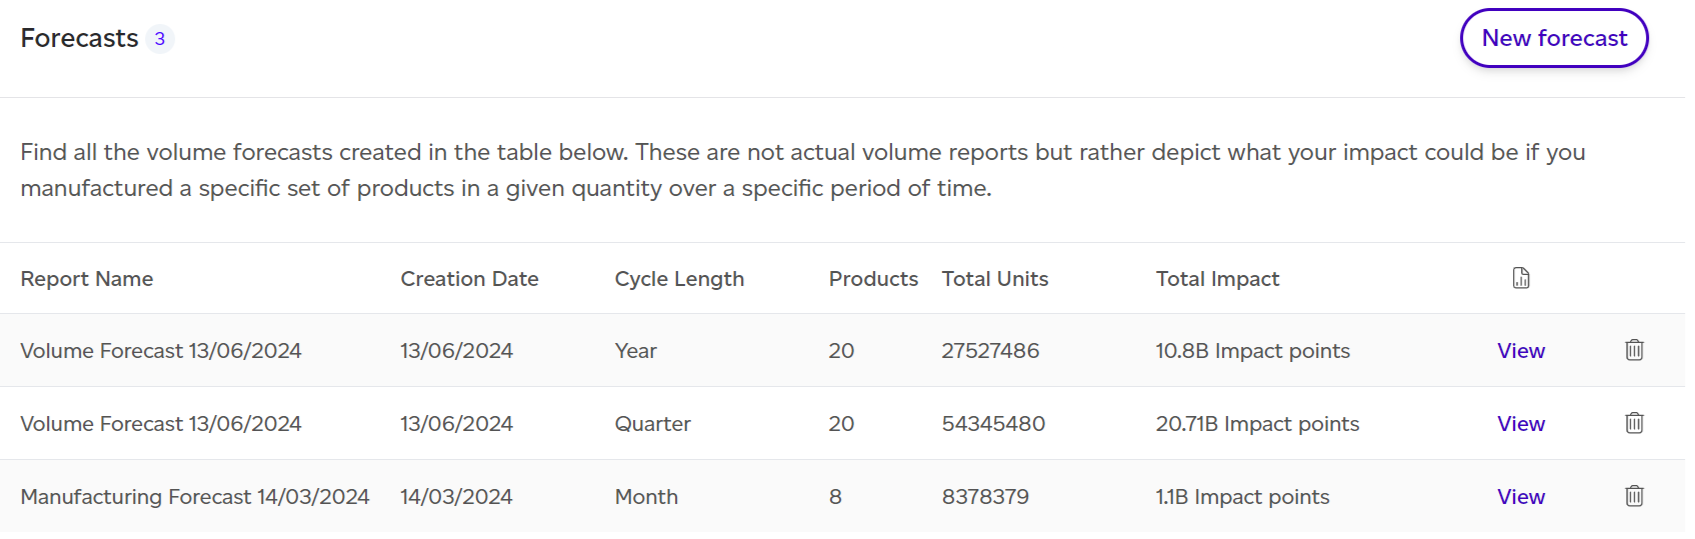
Access forecast reports by selecting Volume from the top menu, then choosing Forecasts to view all available forecasts. Click 'View' next to a report to open it.
Dashboard Overview
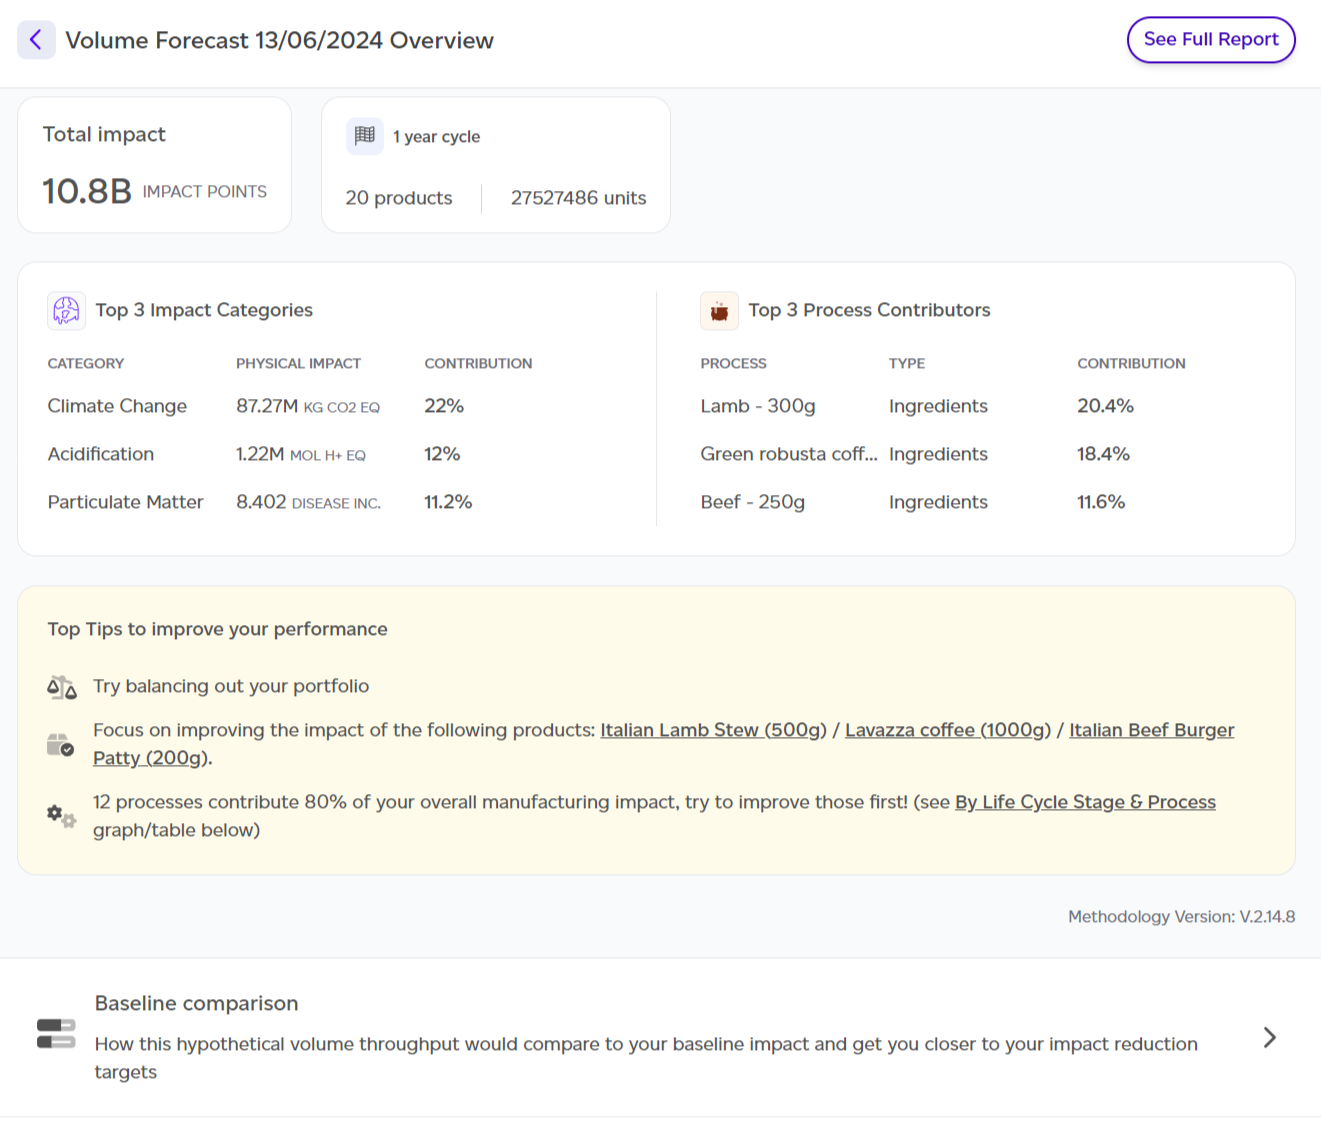
When opening a report, you land on a dashboard summarising key insights:
- Total environmental impact of manufacturing output.
- Manufacturing output overview: Product SKUs, total units, and assessment cycle length.
- Top 3 impact categories and processes.
- Top 3 tips for improving manufacturing output scores.
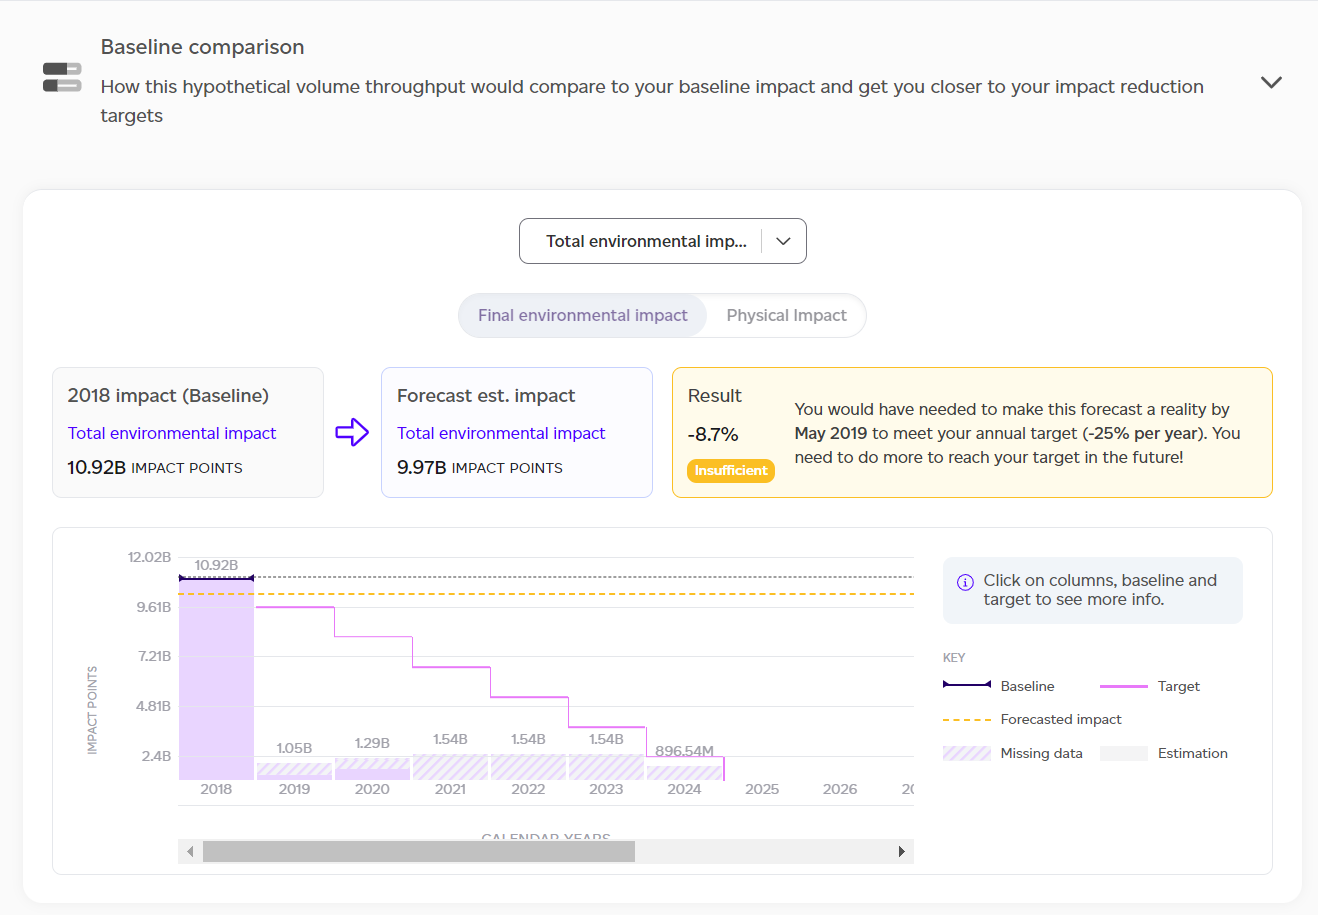
- Baseline comparison: Forecasted impact versus baseline.
- Impact difference with baseline: Graph showing historical data, forecasts, and target achievement dates.
- Worst offenders: Products with highest environmental impact.
- Product contribution to total environmental impact.
- Highest and lowest impact products.
- Breakdown by impact category.
- Impact analysis results summary by category, life cycle stage, and process.
- Major contributors summary.
- Contextual examples: Physical outputs translated into relatable terms (e.g., car journeys, showers).
Full Report Sections
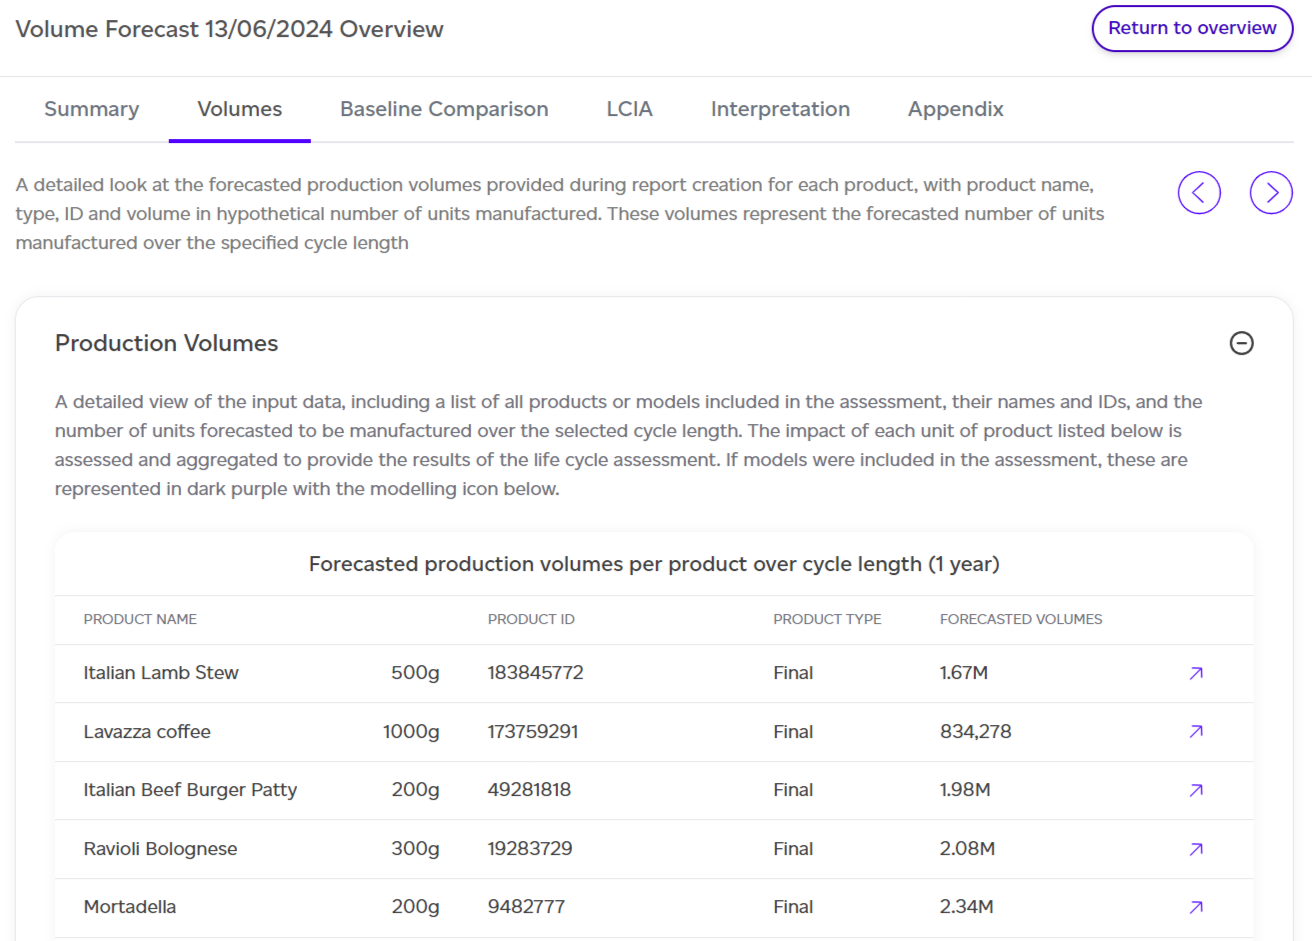
Access the full report by clicking 'See Full Report' at the top. It includes:
- Summary: Overview of products, units, and total impact.
- Volumes: Expected production volumes used in the forecast.
- Baseline comparison: How forecasted volumes align with reduction targets.
- LCIA (Life Cycle Impact Assessment): Results split by product, category, life cycle stage, and process.
- Interpretation: Contextual examples translating impact data.
- Appendix: Four detailed breakdowns covering products, impact categories, normalisation factors, and contextual example assumptions.
Data in tables can be exported as CSV using the 'Export as CSV' option.