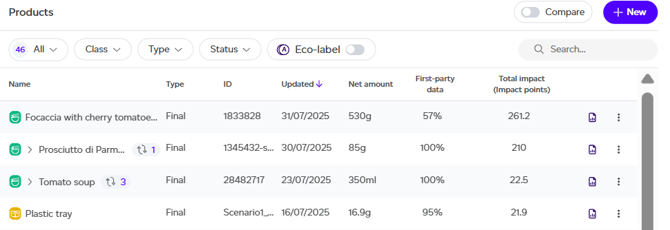
From your Products tab, click on the report icon for the product you wish to view a report for. This will take you to the Product Report Overview, where you can explore various impact assessments and detailed data about the product.
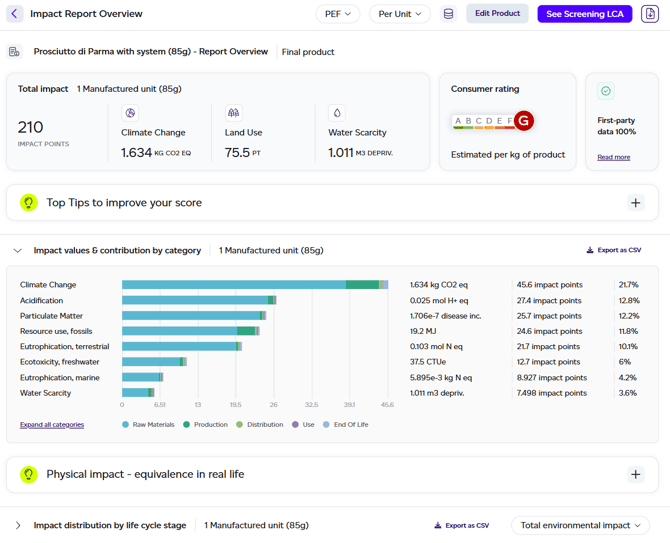
By default, you'll see the PEF report, but you can switch to the GHG Protocol emissions methodology by selecting it from the dropdown at the top. The impact report overview provides a comprehensive summary of the key takeaways from the PEF LCA and displays the following information:
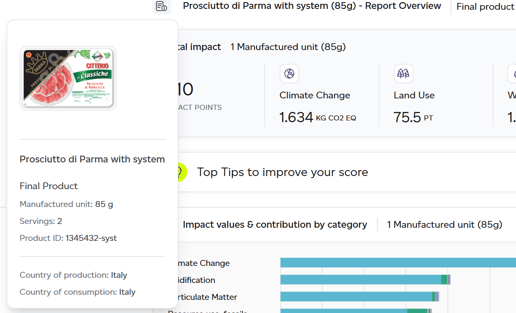
- Product Details: Clicking on the icon next to the product name will reveal some information about the product including its name, country of production, consumption, net amount, number of servings, and a product image (if available).
- Impact Overview: An overview of the product's total environmental impact as well as 3 key impact categories: climate change, land use and water scarcity.
- Consumer Rating: The product consumer rating (A–G), calculated for 1kg of product.
- First Party Data level: Warns the user if the product is incomplete (draft), if the screening threshold hasn't been met (defaults were applied on behalf of the customer), or whether 100% first-party data was achieved meaning the results of the assessments can be used externally.
- Top Tips to improve your score: Suggestions for reducing your product's impact.
- Impact Analysis Results by category: Impact breakdown across all 16 PEF categories with their physical impact, the total impact points (for comparability) and percentage.
- Contextual Examples: Translations of the physical outputs in easy-to-understand examples.
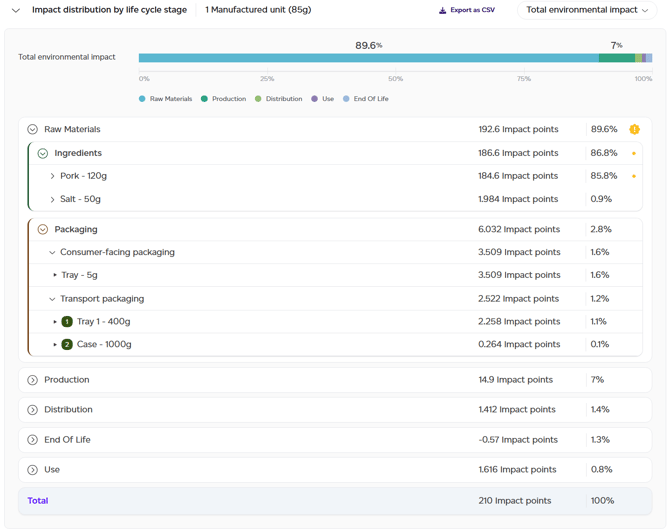
- Impact distribution by life cycle stage: A detailed breakdown of the impact of the product down to the process level for each life cycle stage, presented for the overall impact by default (total environmental impact). The toggle in the top right allows the user to switch to any of the impact categories to view the results. Packaging is broken down between consumer-facing and transport packaging, the latter including the level number to visualise where each packaging item is used.
From this overview, you can:

- Switch methodology: View the GHG protocol emissions report instead.
- Change the lens: switch from the default 'per unit of product' to per kilogram/litre, or per serving if number of servings was specified. This will rescale the numbers automatically to reflect the selection.
- View datasets used: clicking on the dataset icon will open a list of all datasets used in the calculation of the product's impact.
- Edit Product: opens the product graph.
- See Screening LCA: Available only if your product has 100% first-party data, the Screening LCA button brings you to the full report associated with this product (more details below).
- Download summary report: Downloads the 1-page report that can be used for external sharing.
Screening LCA report
The full report accessible only for products with 100% first-party data (no defaults), consists of several sections, each contained within its own tab. You can navigate through these tabs by clicking on them, using the back/next arrows, or the buttons at the bottom of the page.
1. Summary
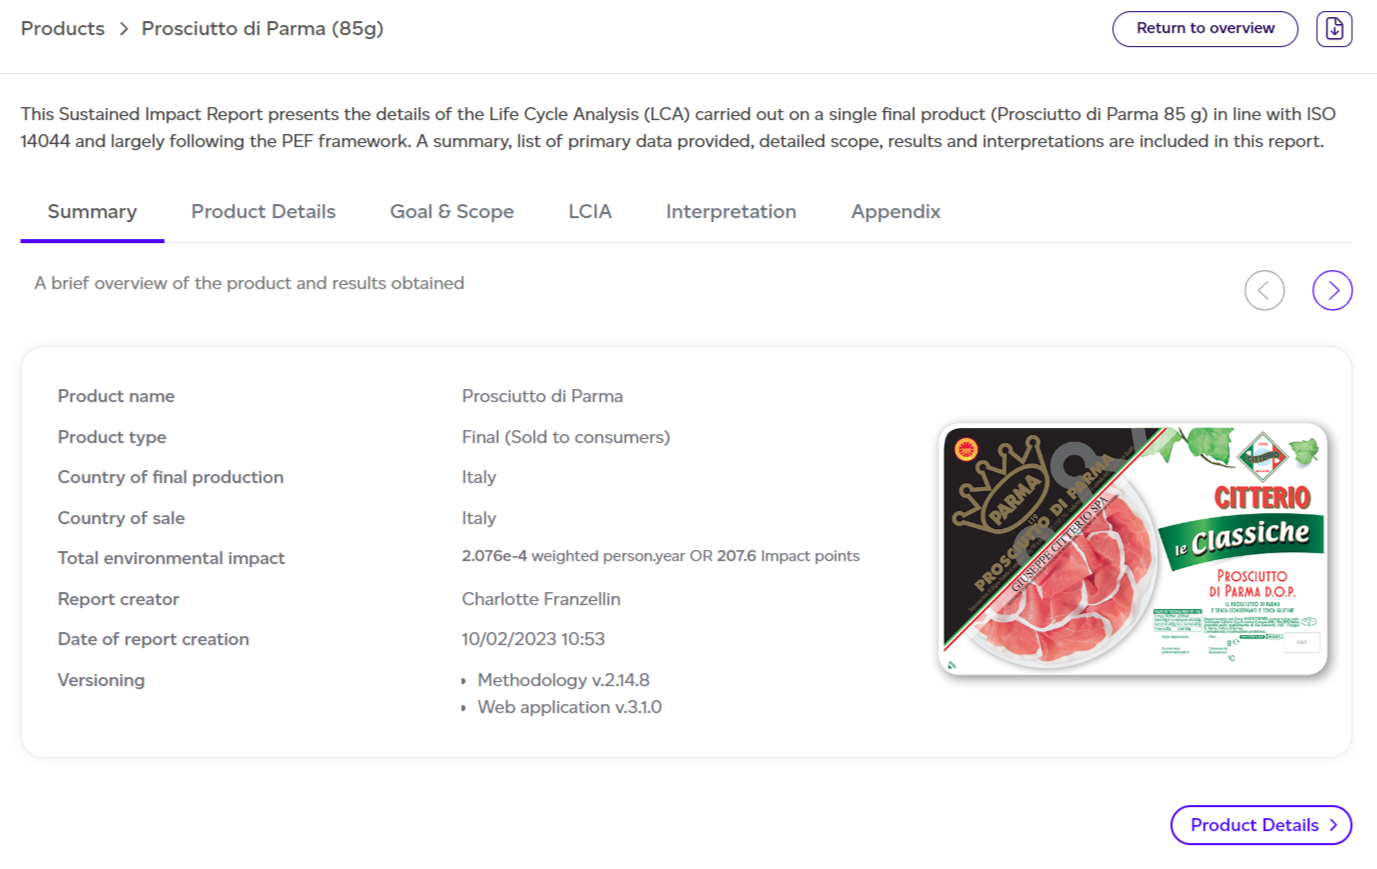
A summary of the report, including total environmental impact, methodology versions, and creator details.
2. Product Details
A summary of general product information with a link to the product graph for more details.
3. Goal & Scope
The scope of the assessment, including goal, functional unit, system boundaries, and methodology overview.
4. Life Cycle Impact Assessment (LCIA)
The main output, detailing the product's impact across 16 categories. Only 13 categories contribute to the total environmental impact, as per PEF recommendations.
The following information is shown:
- Total environmental impact: the normalised and weighted environmental impact for each of the 13 impact categories added together into one metric.
- Total environmental impact breakdown:
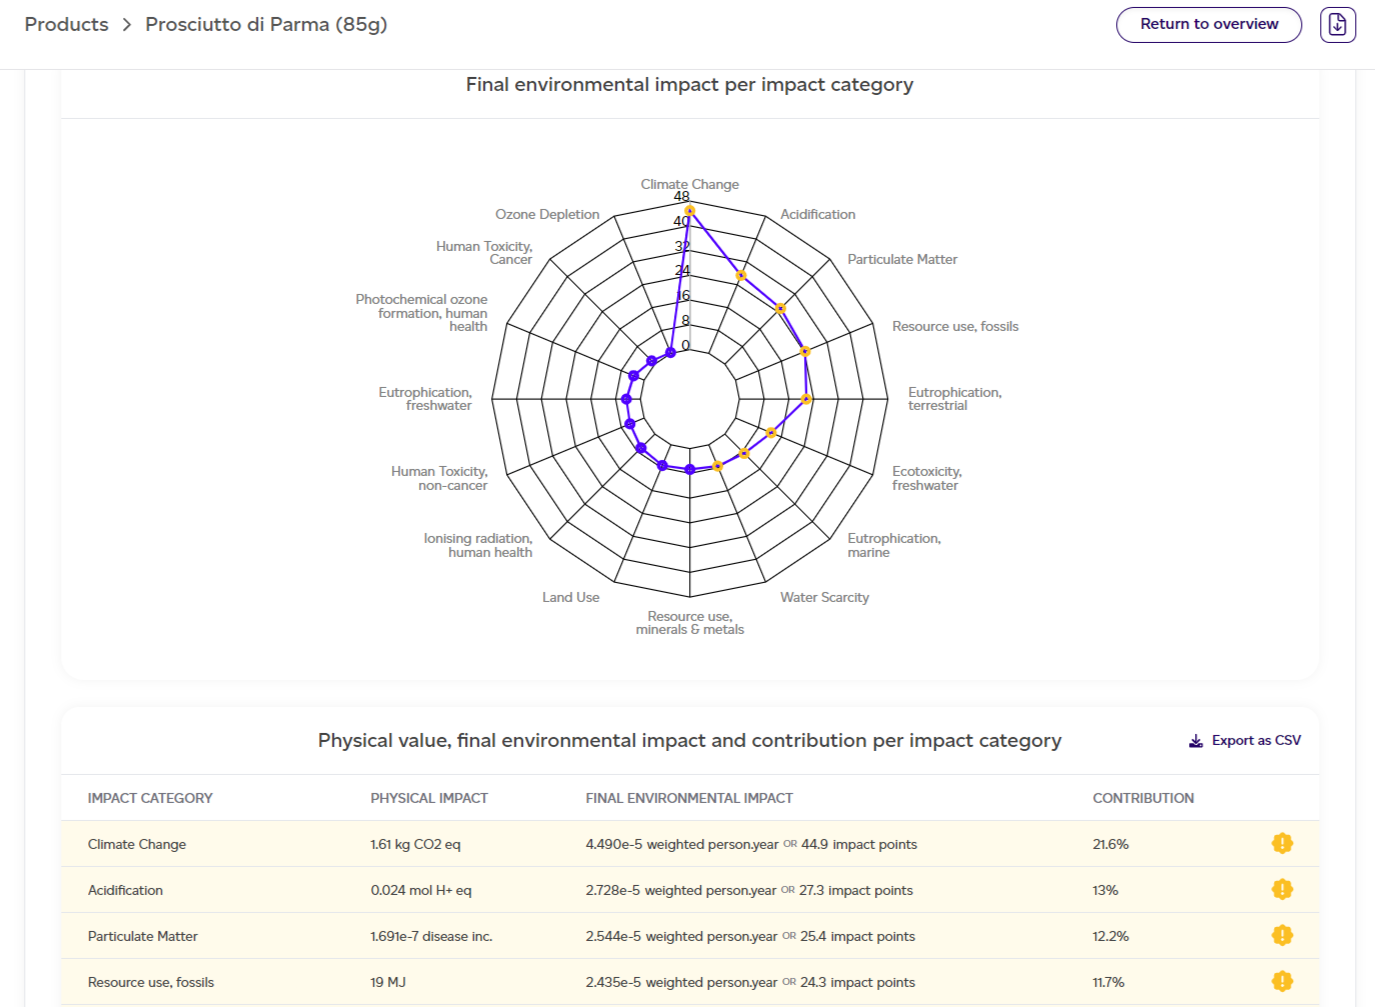
- By impact category: the normalised and weighted environmental impact for each of the 13 impact categories considered, with a table showing physical value, final environmental impact (the final impact calculated for this impact category for the product SKU with both the normalisation and weighting factors applied), and contribution (%) to the total impact.
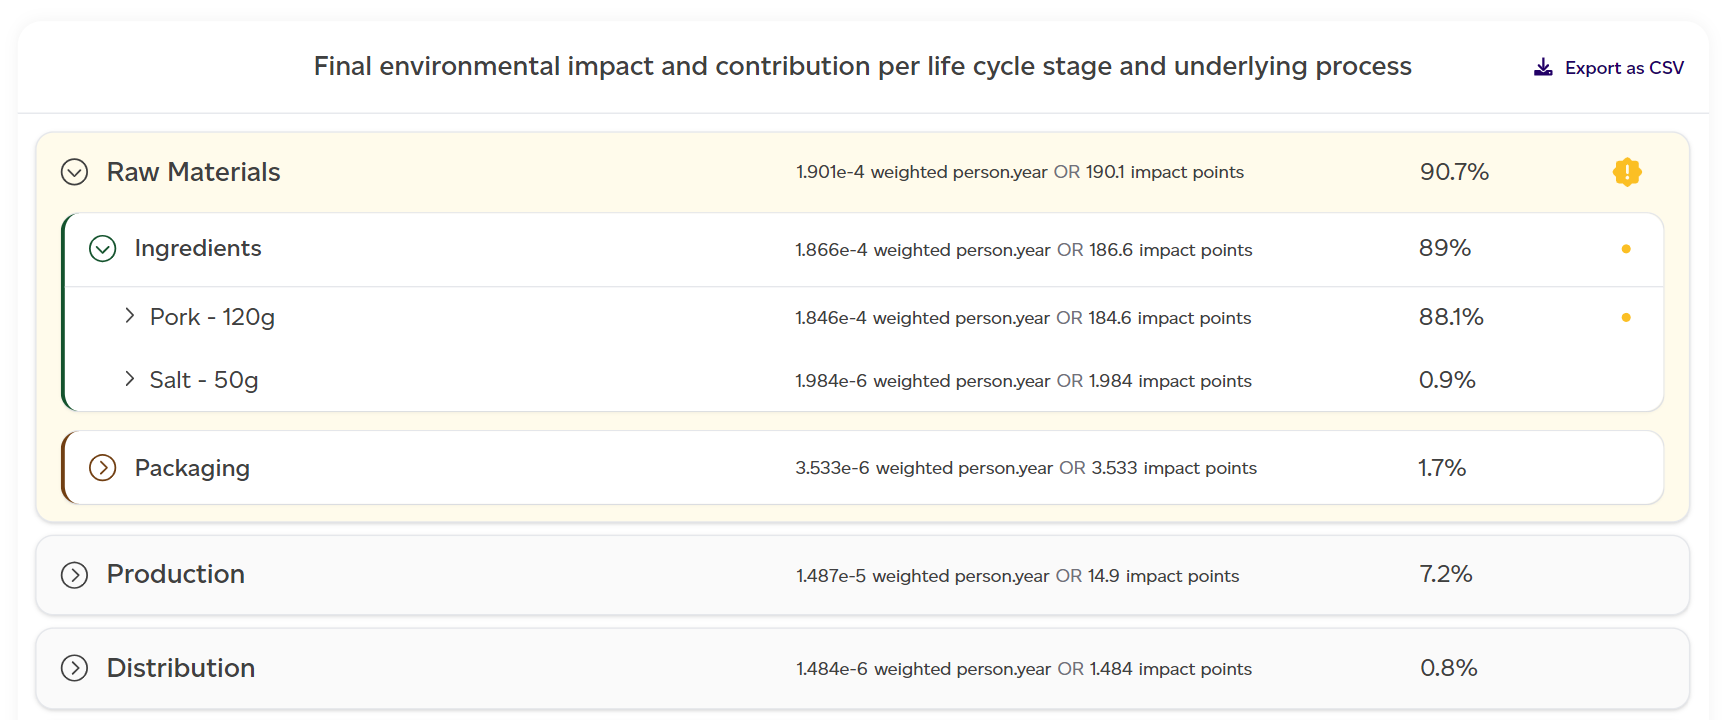
- By life cycle stage: how the final environmental impact is broken down by life cycle stage.
- By process: how each process within the various life cycle stages contributes to this total environmental impact.
Impact categories, life cycles and processes contributing a minimum of 80% of the total environmental impact are highlighted throughout this section in yellow (in the charts and tables). These are the areas that have the largest impact (positive or negative) on your overall product impact.
Every table on this tab can be exported as a CSV file for further analysis. Simply click on the 'Export as csv' button in the right hand corners of the table.
5. Interpretation
Provides context to the results, discusses limitations, software improvements, and offers suggestions for reducing impact.
6. Appendix
The final section of the report contains four appendices:
- Detailed breakdown by impact category — additional detailed information about the environmental impacts of all 16 impact categories and how these are broken down by life cycle stage.
- PEF recommended relevance analysis — deep dive into all the impact categories which contribute 80% of the total environmental impact of the product SKU.
- Normalisation and weighting factors — As recommended by PEF and applied to the output of the analysis.
- Assumptions behind the contextual examples — how these examples from our day to day life have been calculated.