
From Framework to Practice
In Part 1, we introduced the Planetary Boundaries framework and its relationship to PEF impact categories. Now we move from theory to practice: how do you actually read your LCA results through a planetary boundaries lens?
With seven of nine planetary boundaries now exceeded, understanding how your products contribute to these transgressions is no longer an academic exercise — it is a strategic necessity.
PEF-to-Planetary Boundaries Mapping
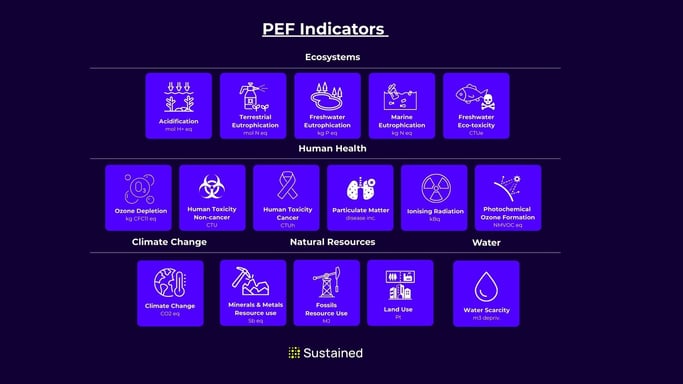
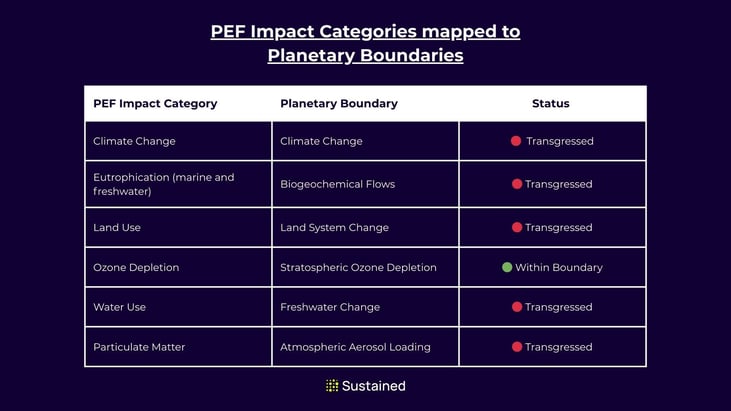
Six PEF impact categories connect directly to planetary boundaries:
- Climate change maps to the Climate Change boundary
- Acidification and Eutrophication (marine and freshwater) map to Biogeochemical Flows
- Land use maps to Land-System Change
- Water use maps to Freshwater Use
- Ozone depletion maps to Stratospheric Ozone Depletion
- Ecotoxicity and Human toxicity relate to Novel Entities
This mapping allows you to translate product-level impact scores into a broader Earth-system context.
A Practical Five-Step Exercise
Step 1: Identify Boundary-Connected Impacts
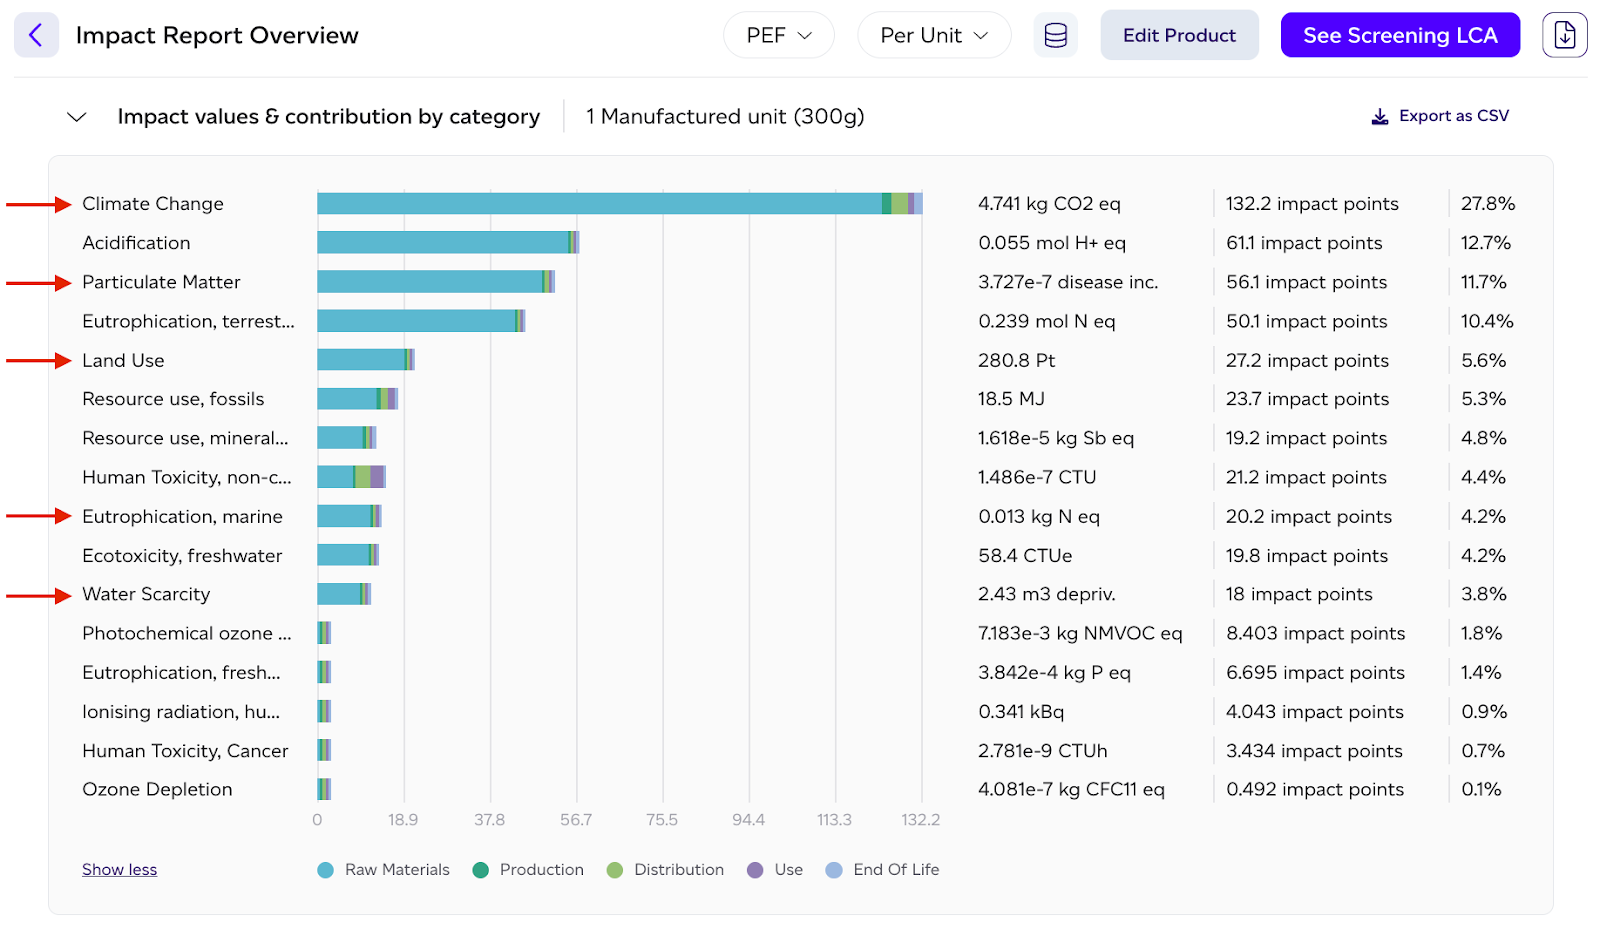
Start by reviewing your product's PEF results and flagging the impact categories that map to transgressed planetary boundaries. If your product scores highly in land use and eutrophication, you are contributing to two boundaries that are already in the danger zone.
Step 2: Find Hotspots
Within each flagged category, identify which ingredients, processes, or supply chain stages are the primary drivers. A dairy-heavy product might show land use driven by feed crop cultivation and eutrophication driven by manure management.
Step 3: Assess Risk
Evaluate the degree of transgression for each relevant boundary. Boundaries that are deeply transgressed (like Biogeochemical Flows) represent higher systemic risk than those only recently crossed.
Step 4: Compare and Prioritise
Across your portfolio, compare products on boundary-connected impacts. This reveals which products pose the greatest planetary risk and where reformulation or sourcing changes would have the most systemic benefit.
Step 5: From Analysis to Action
Translate your findings into concrete strategies:
- Supplier engagement: Share boundary-connected impact data with key suppliers to drive targeted improvements
- Risk mitigation: Prioritise reformulation for products with high exposure to deeply transgressed boundaries
- Monitoring: Track boundary-connected impacts over time to measure progress and respond to new scientific assessments